


 Close Menu
 World
 Biography
 Health
 Education
 Business
 Lifestyle
 Sports
 Technology
 Animals
 History
 Food
 Religious
 Startups
 Movies
 Politics
 Fashion
 Covid
 Diet
 Fitness
 Marketing
 Travel
 Science
 Reviews
 Social media
 Stories
 Facts
 Art
 Entertainment
Retensa

Business
Employee Retention Strategies in 90 Days: An Implementation Roadmap for HR Leaders
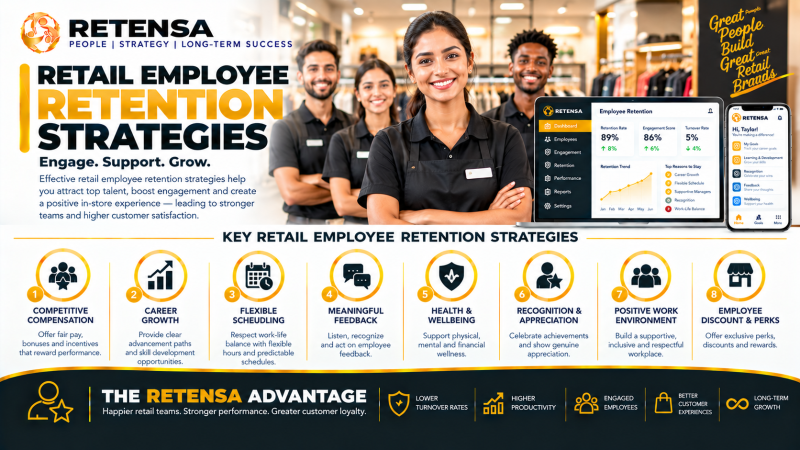 Retensa
Executives rarely doubt the need for employee retention strategies. They doubt how quickly the work can start and how soon results appear. The U.S. Bureau of Labor Statistics recorded 3.1 million quits in August 2026, a 1.9 per cent monthly rate, and Gallup research shows that more than half of exiting employees say their manager or organization could have prevented the departure. A structured 90-day roadmap gives HR leaders a way to start fast and report results within a single quarter.
Retensa, a data-driven employee retention platform with 25 years of results, provides the surveys, diagnostics, and predictive analytics that connect employee data to turnover outcomes. Its contract-backed guarantee carries the risk: if voluntary turnover does not decrease, the employer does not pay. This guide gives CHROs, CPOs, VPs of People, and CFOs a five-phase roadmap with a measurable result at the end of each phase.
A Priced Baseline Anchors the Roadmap
Gallup estimates that replacing one employee costs between one-half and two times that employee's annual salary. Retensa places the cost at $10,000 to $100,000 per employee. Consider an illustration: an employer with 800 employees, 15 per cent voluntary turnover, and a $65,000 average salary loses 120 employees a year, which implies $3.9 million to $15.6 million in replacement costs at Gallup's range.
Leaders who want to know how to reduce employee turnover begin with that number. The Retensa Find Your Cost of Turnover tool converts industry, headcount, and current turnover rate into an estimated annual savings figure in about 60 seconds, which gives finance and HR one dollar target to share before any initiative begins. Employers that start here can report the dollar value of each avoided resignation at every quarterly review, and the estimate rests on the employer's own headcount and turnover rate instead of an industry average.
A 90-Day Roadmap for Lowering Voluntary Turnover
The sequence below is a practical way to organize the work, and each phase produces a deliverable that the board can review.
1. Days 1 to 14: Price the Baseline and Set the Target
The first two weeks produce the cost baseline, a target reduction, and a named executive sponsor. Finance compares the Retensa estimate with Gallup's replacement-cost range and selects a conservative figure. HR segments current quits by department, tenure band, and role. The deliverable is a one-page baseline that states annual quits, cost per quit, and the target reduction in dollars. A conservative baseline protects the credibility of every later number, because the board sees the assumptions behind it.
2. Days 15 to 30: Run the Diagnostic
The Retensa Retention Diagnostic identifies why employees quit and measures the financial impact of each driver, ranking 24 workplace attractors and detractors and trending them over time. ExitPro automates exit interviews and identifies primary and secondary drivers of turnover across departments. The deliverable is a prioritized list of the three or four drivers with the largest financial impact, each with a projected saving. Leaders then fund the largest opportunities first instead of spreading budget across every suggestion. Retensa reports that preventive action based on diagnostic findings can begin reducing attrition in as little as three weeks.
3. Days 31 to 45: Write the Employee Retention Plan
A written employee retention plan assigns each priority driver to a named leader, sets a quarterly target for the affected department, and schedules a review. A plan might give onboarding quality to the VP of People with a goal of fewer early-tenure quits within two quarters, and give workload concerns to operations leadership with a monthly pulse check. Retensa configures each plan around industry, headcount, current turnover rate, and target reduction. The deliverable is a signed plan with owners, targets, and dates. Reviews at 30, 90, and 180 days keep the targets visible, and the plan names the metric that each owner reports at every review.
4. Days 46 to 60: Equip Managers and Launch Pulse Surveys
Gallup research attributes at least 70 per cent of the variance in team engagement to the manager, and Gallup found that 51 per cent of exiting employees had no conversation with a manager or leader about their job satisfaction or future in the three months before they quit. Retensa Retention Skills Training teaches managers to run stay interviews and deliver recognition, and TalentPulse launches short surveys that measure engagement, loyalty, trust, and connectedness. The deliverable is a first pulse reading and a count of completed stay conversations. Higher survey participation also improves data quality, and managers who act on feedback within days give employees a reason to keep responding.
5. Days 61 to 90: Flag Risk and Review Results
The Attrition Risk Matrix categorizes employees by resignation likelihood, and the Retention Metrics Dashboard delivers real-time engagement trends by department. Leaders hold stay conversations with flagged high-value employees and compare the first quarter's results with the baseline. The deliverable is a board-ready summary: quit rate by department, the dollar value of avoided resignations so far, and the plan for the next quarter. Employers that review the quit rate in flagged roles monthly see early whether outreach works, and they adjust before the quarter closes.
Governance Keeps the Roadmap on Schedule
A roadmap needs named roles. The executive sponsor, usually the CHRO or CFO, owns the target and removes obstacles. The HR lead owns the diagnostic, the plan, and the reporting rhythm. Finance validates the baseline and the savings calculation. Business unit leaders own the drivers assigned to their departments and report progress at each review.
A weekly 20-minute check-in during the first 30 days keeps the work moving, and a monthly review afterward keeps owners accountable. Employers measure governance through the share of review dates met and the share of owners who report their metric on time, and both figures belong in the board summary.
A Talent Retention Program Protects Critical Roles
Not every role carries the same replacement cost, so a talent retention program concentrates attention on roles that the business cannot absorb losing. During the roadmap, HR identifies those roles, flags the employees in them who show elevated risk, and assigns an executive to hold stay conversations. Employers measure the program through the quit rate in flagged roles, reviewed monthly, and through the share of critical roles with a documented successor. Retensa configures each program around industry, headcount, current turnover rate, and target reduction, so the list of critical roles reflects the employer's actual situation.
Evidence Across Industries Supports the Approach
Retensa reports turnover reductions across sectors: 42 per cent for manufacturing operators, 44 per cent for hospitality staff, 39 per cent for law firm associates and for technology developers, 40 per cent for financial analysts in under nine months, 35 per cent in municipal government, and 38 per cent for nurses in under 12 months. BLS data for August 2026 shows how much starting points differ, from 3.5 per cent in accommodation and food services to 1.0 per cent in finance and insurance and 0.7 per cent in government. Employers therefore set targets against their own baseline and sector norm. A target that respects the starting point is far more likely to be met, and a board that sees the benchmark trusts the number. Each quarter, leaders compare the employer's result with that benchmark and report the gap in dollars.
A Guarantee Moves Roadmap Risk Off the Balance Sheet
Retention budgets stall when results arrive late and attribution stays unclear. Retensa addresses both problems through a configurable guarantee. The employer selects industry, headcount, current turnover rate, and a target reduction, and the platform calculates the implementation timeline, investment, employees retained, and estimated annual savings before any engagement begins. If voluntary turnover does not decrease, the employer does not pay.
CFOs gain a modeled return with downside protection, and CHROs gain a commitment with dates attached. Retensa serves more than 1,000 organizations across 59 countries and 22 languages and cites a 98 per cent success rate. Finance teams can compare the modeled savings with the Gallup replacement-cost range before approving budget, which shortens the path from proposal to decision.
A Board-Ready Result at Day 90
Employers that price the baseline, run the diagnostic, write the plan, equip managers, and flag risk can present a measured comparison against the baseline at day 90 and a full-year savings calculation at twelve months. Retensa delivers that view in one platform, with turnover reductions that can begin in as little as three weeks and a savings estimate fixed before the engagement starts. At day 90, the board sees the quit rate against the baseline, the dollar value of avoided resignations, and the next quarter's priorities, which turns a 90-day sprint into a repeatable quarterly rhythm that the board can follow and finance can verify against payroll each quarter.
Frequently Asked Questions
How can HR leaders start a retention initiative quickly?
HR leaders start by pricing the baseline and naming an executive sponsor in the first two weeks, then run a diagnostic to rank turnover drivers. A signed plan with owners, targets, and dates follows by day 45.
How can finance leaders approve retention spending with confidence?
Finance leaders compare the modeled savings estimate with Gallup's replacement-cost range before approving budget. Retensa calculates the implementation timeline, investment, employees retained, and estimated annual savings before engagement begins, so the downside is clear.
How can employers choose which turnover drivers to fix first?
Employers rank drivers by financial impact. The Retention Diagnostic measures the cost of each of 24 attractors and detractors, so leaders fund the three or four largest drivers instead of spreading budget across every suggestion.
How can managers contribute in the first 90 days?
Managers complete Retention Skills Training, hold one documented stay conversation per employee, and review their team's pulse results. HR tracks completion and compares team quit rates across the following two quarters.
How can employers invest in retention without financial risk?
A contract-backed guarantee reduces the risk. Retensa configures it by industry, headcount, current turnover rate, and target reduction, models savings before engagement begins, and charges nothing if voluntary turnover does not decrease.
Source:
Click for the: Full Story
You might like









You Might Like this