Close Menu
Power Pairs
Business
Top Technical Indicators for TradingView Pairs Trading Strategies
Pairs trading is a popular market-neutral strategy that involves trading two correlated assets simultaneously. Traders usually buy one asset and sell another when the relationship between them temporarily diverges. To effectively identify these opportunities, traders rely on powerful charting platforms like TradingView. This platform provides a wide range of technical indicators that help traders analyze price relationships and make informed trading decisions.
Using the right indicators can significantly improve the accuracy of pairs trading strategies. Below are some of the most useful technical indicators traders use on tradingview pairs trading strategies analysis.
Moving Averages
Moving averages are among the most commonly used indicators in technical analysis. They help smooth out price data and reveal the overall trend of an asset. In pairs trading, moving averages can be used to analyze the price ratio or spread between two correlated assets.
For example, traders may calculate the ratio of two stocks and apply a moving average to that ratio chart. If the ratio moves far away from the average, it may indicate that the pair is temporarily mispriced. Traders then expect the ratio to revert back toward the average over time.
Simple Moving Average (SMA) and Exponential Moving Average (EMA) are the most widely used types.
Bollinger Bands
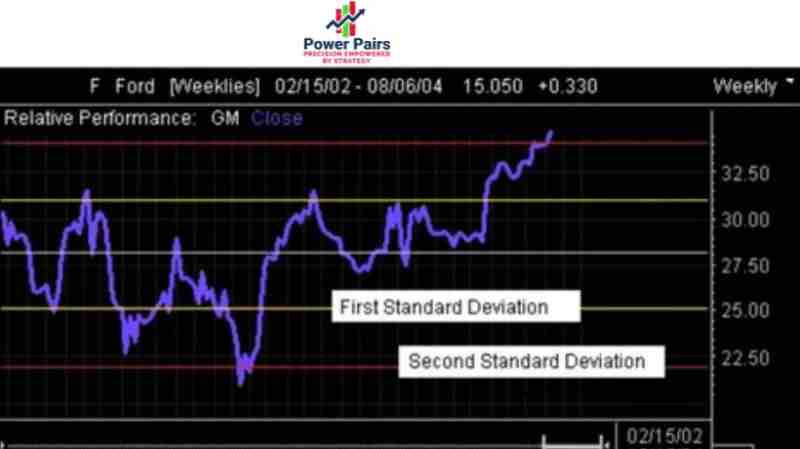
Bollinger Bands are another powerful indicator for pairs trading strategies. This indicator consists of a middle moving average and two outer bands that represent volatility levels.
When the spread or ratio between two assets moves toward the upper band, the pair may be considered overextended. Similarly, when the spread touches the lower band, the assets may be undervalued relative to each other.
Pairs traders often use Bollinger Bands to identify entry and exit points when the price spread deviates significantly from its normal range.
Relative Strength Index (RSI)
The Relative Strength Index (RSI) is a momentum indicator that measures the strength of price movements. It ranges from 0 to 100 and helps traders identify overbought or oversold conditions.
In pairs trading, RSI can be applied to the spread or ratio chart between two assets. If the RSI indicates overbought conditions, traders may expect the spread to decline. If it signals oversold conditions, the spread may increase.
RSI is particularly useful for identifying potential reversal points within a pairs trading strategy.
Correlation Indicator
Correlation plays a critical role in pairs trading. The strategy works best when the two assets have historically moved together. TradingView provides correlation tools that help traders measure the strength of the relationship between two securities.
A high correlation value indicates that the two assets tend to move in the same direction. When the correlation temporarily weakens or the price relationship diverges, traders may find a potential pairs trading opportunity.
Monitoring correlation helps traders avoid trading pairs that do not have a strong historical relationship.
Moving Average Convergence Divergence (MACD)
The MACD indicator is widely used to analyze momentum and trend changes. It consists of two lines and a histogram that shows the difference between them.
In pairs trading, MACD can help traders detect momentum changes in the spread between two assets. When the MACD line crosses above the signal line, it may indicate that the spread is beginning to rise. When it crosses below, the spread may begin to narrow.
Using MACD alongside other indicators helps traders confirm trading signals and reduce false entries.
Volume Analysis
Although pairs trading focuses primarily on price relationships, volume analysis can also provide valuable insights. Volume indicators show how actively an asset is being traded during a specific time period.
If a spread breakout occurs with strong volume, it may indicate a stronger and more reliable trading signal. Volume confirmation helps traders ensure that market participants support the price movement.
Final Thoughts
Technical indicators play a crucial role in developing successful pairs trading strategies on TradingView. Indicators such as moving averages, Bollinger Bands, RSI, correlation tools, MACD, and volume analysis help traders identify divergences between correlated assets.
However, no indicator guarantees perfect results. Successful traders usually combine multiple indicators and use proper risk management to improve their trading performance. By understanding and applying these technical indicators, traders can enhance their pairs trading strategies and uncover more consistent trading opportunities in the market.
Source:
Click for the: Full Story
You might like