Close Menu
 World
 Biography
 Health
 Education
 Business
 Lifestyle
 Sports
 Technology
 Animals
 History
 Food
 Religious
 Startups
 Movies
 Politics
 Fashion
 Covid
 Diet
 Fitness
 Marketing
 Travel
 Science
 Reviews
 Social media
 Stories
 Facts
 Art
 Entertainment
Retensa

Business
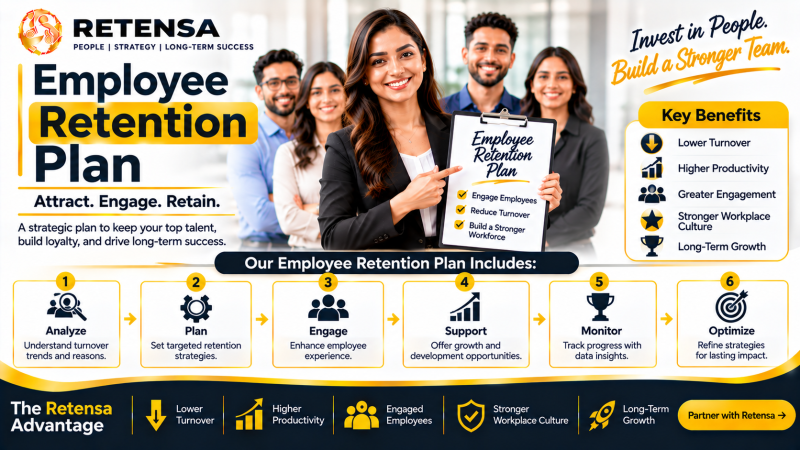
Employee Retention Plan Template: A One-Page Structure Executives Can Approve in One Meeting
 Retensa
An employee retention plan earns approval faster when it fits on one page and answers the questions executives ask first: how big is the problem, what causes it, what will change, who owns it, and how will progress be measured. Gallup found that 52 per cent of employees who quit voluntarily say their manager or employer could have prevented the exit, and Gallup research shows that managers account for at least 70 per cent of the variance in team engagement. HR leaders who bring a one-page employee retention plan to leadership give executives a short, specific document they can approve, fund, and review every quarter.
Retensa is a data-driven employee retention platform that provides diagnostics, predictive analytics, and survey software built on 25 years of retention science. It serves more than 1,000 employers across 59 countries and 22 languages. This guide gives CHROs, HR directors, and CFOs a seven-section template, the data that fills each section, and an example that shows how the pieces fit together.
A One-Page Plan Makes Retention Easy to Approve
Long retention documents tend to sit unread. A one-page plan forces choices: which segments matter most, which drivers to fix first, and which numbers will show progress. Each choice shows leadership that the work is focused.
The cost of turnover supports the effort. Gallup estimates that replacing one employee costs between one-half and two times annual salary, and Retensa data places the cost between $10,000 and $100,000 per employee. Retensa data indicates that 94 per cent of turnover is preventable, so a focused plan can recover a large share of the cost.
Consider an illustrative employer with 1,100 employees and 23 per cent annual turnover, which loses 253 people a year. A 12 per cent reduction, the low end of Retensa's published results, retains 30 employees. At a $56,000 salary and Gallup's 0.5 replacement multiplier, that retention preserves about $840,000 annually. The plan below is built to capture it.
Seven Sections Make a Complete Plan
Each section answers one question and ends with a number. Together they fit on a single page.
1. Baseline and Cost
The first section states current voluntary turnover by segment and the annual cost. Executives who want to reduce employee turnover start here. Retensa's cost of turnover calculator converts headcount, turnover rate, and salary into an annual cost figure in under 60 seconds, and the Total Cost of Management calculator extends the view to the full expense of each role.
The number is the annual cost of turnover, signed by HR and finance.
2. Top Drivers
The second section lists the three drivers that account for the largest share of exits. The Retention Diagnostic identifies the 24 attractors and detractors that pull employees in or push them away, then ranks and trends each by department, tenure, and role. ExitPro automates exit interviews and identifies the primary and secondary drivers of turnover across departments.
The number is each top driver's share of exits.
3. Target and Date
The third section sets the goal: the target turnover rate by segment and the date of the first review. Gallup's 2020 Q12 meta-analysis found that top-quartile engagement teams record 18 per cent lower turnover in high-turnover organizations and 43 per cent lower turnover in low-turnover organizations than bottom-quartile teams, so the gap between an employer's strongest and weakest teams offers a practical first target.
4. Priority Actions
The fourth section names the actions that address the top drivers. Employers that want to improve employee retention list three actions, each tied to one driver. Examples include a structured onboarding check-in, a career conversation for every high-risk employee, and a response standard for employee feedback.
The number is the count of actions with an owner and a due date.
5. Owners and Manager Conversations
The fifth section names one accountable leader for each action. Retention Skills Training teaches managers the conversations that matter, and Gallup found that 51 per cent of exiting employees had no conversation about their future in their final three months.
The number is the share of high-risk employees with a documented manager conversation within two weeks.
6. Early-Warning Indicators
The sixth section lists the indicators that move before turnover does. The Attrition Risk Matrix categorizes employees by resignation likelihood, and TalentPulse applies machine learning to predict workforce connectedness, loyalty, engagement, trust, and risk. Retensa reports that acting on predictive insights prevents attrition in as little as three weeks.
The number is the count of high-risk teams, reviewed monthly.
7. Review Cadence and Return Test
The seventh section sets the quarterly review dates and the return test. Retensa backs its solutions with a contract-backed guarantee: if voluntary turnover does not fall, the employer does not pay. Finance leaders compare avoided turnover cost against the investment and report the ratio each quarter.
Contributors Share the Work
A plan succeeds when each contributor knows the part they own. Three roles carry most of the work.
1. HR Owns the Data and the Calendar
HR produces the baseline, publishes the driver report, and schedules the quarterly review. A platform automates collection and reporting, so HR spends time on follow-up instead of assembly.
2. Finance Owns the Return Test
Finance confirms the cost basis, the replacement multiplier, and the return calculation. In the 1,100-employee example, each percentage point removed retains 11 employees, worth about $308,000 at the same assumptions.
3. Outside Support Adds Facilitation
Some employers also engage an employee retention consultant to facilitate leadership workshops or challenge assumptions. The plan gives any outside support a clear brief: the baseline, the three drivers, the target, and the review dates. The metric is the share of outside deliverables that map to a plan section.
New Hires Deserve a Dedicated Line
Employers that want to increase employee retention often find the fastest gains in the first year. Gallup reports that only 12 per cent of employees strongly agree their employer does a great job of onboarding, and new hires need about 12 months to reach full performance. Gallup also finds that employees are 3.4 times as likely to rate onboarding as exceptional when their manager takes an active role.
TalentPulse captures feedback from onboarding forward, so managers see disengagement while a conversation can still change the outcome. The plan adds one line for cohort retention at 90 days and 12 months, with a target for each.
A Filled Example Shows the Plan in Action
The illustrative employer from earlier fills the template as follows. The baseline is 23 per cent voluntary turnover and an annual cost of about $7.1 million. The top three drivers account for the largest shares of exits and each has an owner. The target is a 12 per cent reduction in turnover by the end of the year, with the first review in 90 days.
Three actions address the top drivers: an onboarding check-in at 30, 60, and 90 days, a career conversation for every high-risk employee within two weeks, and a published response to the top three employee feedback themes each quarter. The early-warning indicator is the count of high-risk teams, and the review cadence is quarterly. Each section ends with a number, and the page ends with the return test. Leadership reads the page in a few minutes, approves the budget in one meeting, and knows exactly which numbers to review at day 90. The metric is the time from first presentation to approved plan, and the target is a single meeting.
Updating the Plan Keeps It Alive
A plan loses value when it stays frozen. Three habits keep it current.
1. Refresh Numbers Each Quarter
Each quarterly review updates the baseline, the driver shares, and the high-risk team count. The metric is the share of plan numbers updated on schedule.
2. Replace Completed Actions
When an action reaches its target, it comes off the page and a new action takes its place. Gallup reports that global employee engagement fell from 23 per cent to 21 per cent in 2024, so a living plan keeps pace with changing conditions.
3. Share the Plan Widely
Managers, directors, and executives all see the same page. Shared visibility keeps every leader working from the same priorities, and the metric is the share of managers who have reviewed the plan.
A Clear Plan Converts Intent Into Results
A one-page plan with seven sections gives executives what they need to approve and fund retention work, and gives managers what they need to act. Gallup data shows that 52 per cent of employees who quit say their employer could have intervened, and that preventable share is the opportunity. Employers that follow the template can measure turnover reductions in the range Retensa has published, from 12 per cent to 67 per cent, with attrition prevention beginning in as little as three weeks.
Frequently Asked Questions About Employee Retention Plans
How can HR leaders build a retention plan quickly?
HR leaders fill seven sections: baseline and cost, top drivers, target and date, priority actions, owners, early-warning indicators, and review cadence. Retensa's diagnostic, cost calculator, and dashboard supply the data for most sections.
How can employers choose the right actions for a retention plan?
Employers choose actions that address the top three drivers by share of exits. The Retention Diagnostic ranks 24 attractors and detractors by department, tenure, and role, and ExitPro identifies the drivers behind actual exits.
How can finance teams review a retention plan?
Finance teams confirm the cost basis, the replacement multiplier, and the expected return. Gallup places replacement cost between one-half and two times annual salary, and each percentage point removed from a 1,100-person workforce retains 11 employees.
How can leaders keep a retention plan from going stale?
Leaders update the baseline, driver shares, and high-risk team count each quarter, replace completed actions, and share the page with every manager. A fixed review calendar exposes drift within one quarter instead of one year.
How can employers measure whether the plan is working?
Employers watch voluntary turnover by segment, each top driver's share of exits, the count of high-risk teams, and cohort retention. Retensa's contract-backed guarantee adds a defined test: if voluntary turnover does not fall, the employer does not pay.
Source:
Click for the: Full Story
You might like